Power BI is an extremely powerful data visualization tool that enables organizations to create and share interactive data dashboards. The software provides a wide range of customizable visualizations, filters, diagrams, and even analytics functionalities. Below an example of an embedded Power BI report which visualizes player performances of NAC breda in the season 2020-2021. The dashboards provides statistics for passing, shooting, defending, and duals for each player.
Sales visualization
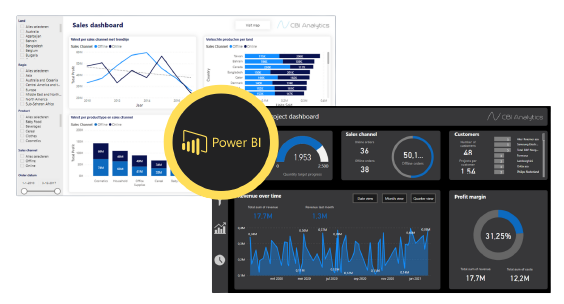
Sales Dashboard
The dashboard below visualizes the sales based on a test dataset. Similarly to the player performance dashboard the user is able to utilize several filters and views. By clicking the buttons the user can see several types of visualizations, such as a map, or change the visual type on the bottom of the screen. As this example shows, the possibilities in this software are quite extensive.