


In this tutorial series I show how you can use the Google Maps API in your Django application. This API can be used for geocoding, reverse geocoding, distance calculations, and displaying maps in your application.
In this post we will use the Google Maps JavaScript API to place markers on our map.
On the end of the last post we ended with a map in our application. Now we continue and plot data on our map!
Prerequisites for this tutorial
Before you can use the Google Maps API you need the following things:
- Enable the Google Maps JavaScript API on the Google Cloud Platform.
- Specify the credentials of the API in the settings.py file of your Django app.
Both of these steps have been covered in a previous blogpost. The full project code can be found on my Github.

IT IS KEY to first complete the steps in the previous tutorial. There are some CRUCIAL steps you need to complete to get the google maps such as:
- Including a specific link in your html file that enables the rendering of the map (polyfill)
- Specifying your Google API Key in your Google Request.
- Configure width and height of the map in your CSS file
In this tutorial I will show you:
- The model structure and the data I want to display on my map
- How to pass data from the model to the frontend
- How to view the data in our console
- How to place the markers on our map
Model structure and data in my project
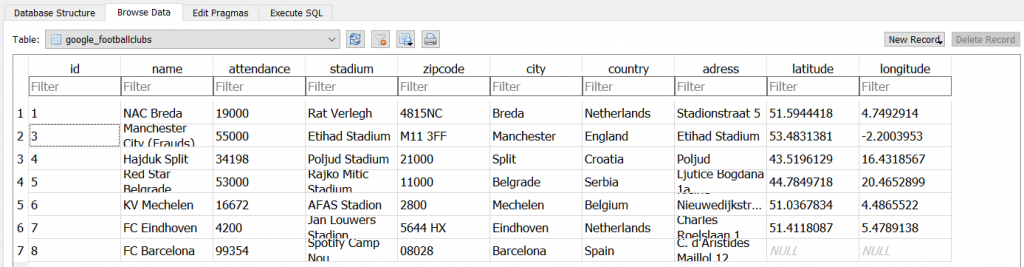
In our project we have converted several adress strings into coordinates (see previous tutorial). I now want to plot the coordinates from my database in my map. This is my model structure:
from django.db import models

# Create your models here.
class FootballClubs(models.Model):
    name = models.CharField(max_length=200, unique=True)
    attendance = models.IntegerField(blank=True, null=True)
    stadium = models.CharField(max_length=200,blank=True, null=True)
    zipcode = models.CharField(max_length=200,blank=True, null=True)
    city = models.CharField(max_length=200,blank=True, null=True)
    country = models.CharField(max_length=200,blank=True, null=True)
    adress = models.CharField(max_length=200,blank=True, null=True)
    latitude = models.CharField(max_length=200,blank=True, null=True)
    longitude = models.CharField(max_length=200,blank=True, null=True)


    def __str__(self):
        return self.name
And this is the data currently in my database:
Passing data from the model to the frontend
We need to get the data from our database into our html template. In order to do that we use a JsonResponse.
To realize this we first need to create an additional url in our urls.py file. This url will serve as the api to our frontend.
from .views import *
from django.urls import path, include
from google import views as view

urlpatterns = [
   ...
   path('mydata',view.mydata, name="mydata"),
   ...
]
Now we need to create a view that tells the url to provide data to our template. We do this with a JsonResponse.
- In our view we first create a list
- We specify the model and exclude rows that have a latitude or longitude equal to null or blank. These markers will not be plotted on the map.
- We define the attributes from our database we want to use.
- We return the jsonresponse with our full query.
def mydata(request):
    result_list = list(FootballClubs.objects\
                .exclude(latitude__isnull=True)\
                .exclude(longitude__isnull=True)\
                .exclude(latitude__exact='')\
                .exclude(longitude__exact='')\
                .values('id',
                        'name',
                        'latitude',
                        'longitude',
                        'attendance',
                        'stadium',
                        'country',
                        ))

    return JsonResponse(result_list, safe=False)
View the data in our console
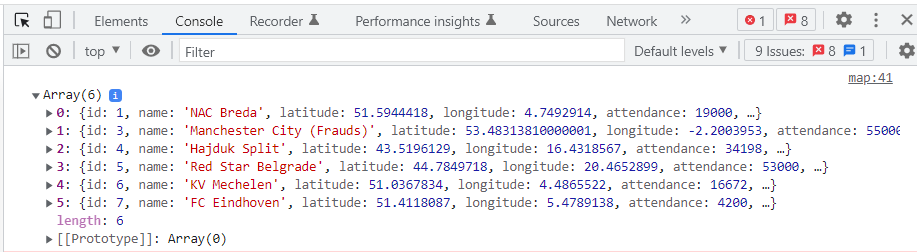
We created a view, let’s check if the data actually arrives in our template. We do this through an ajax call. Go to your template and add the following script to your map.html file. In the url, specify the name of the url you created, in this case mydata. The console.log function will show our data in the console.
...
<script>
        $.ajax({
          url: "{% url 'mydata'%}",
          method: 'GET',
          success: function (data) {
              console.log(data);
          }
      });
</script>
...
If we start our server and open the console (Ctrl +Shift +J) we see the data in our console!
Placing markers on our map
Since our data is visible, we are now able to place the markers on the map.
In our previous post we already explained how you can plot an empty map in your application. This is CRUCIAL for this tutorial. You have to complete the steps from the previous tutorial to get the desired results.
We need to modify the script in our map.html file to the code below
...
<script>
    $(document).ready(function(){
        $.ajax({
            url: "{% url 'mydata'%}",
            method: 'GET',
            success: function (data) {
                console.log(data);
                initMap(data);
            }
      });
    });

    function initMap(data) {
       const map = new google.maps.Map(document.getElementById('map'), {
          zoom: 4,
          center: {lat: 51.5944418, lng: 4.7492914}
       });
       const markers = data?.map((i) => {
            const marker = new google.maps.Marker({
                position: { lat: parseFloat(i.latitude), lng: parseFloat(i.longitude)},
                map: map,
            })
        });
     }
  </script>
...
The code goed through the following steps:
- Once the document is ready, the ajax scripts gets the data from our url endpoint.
- When the data is retrieved successfully, the InitMap function is called, and the data is passed to that function so we can use it.
- In the InitMap function we create the map (similar like before).
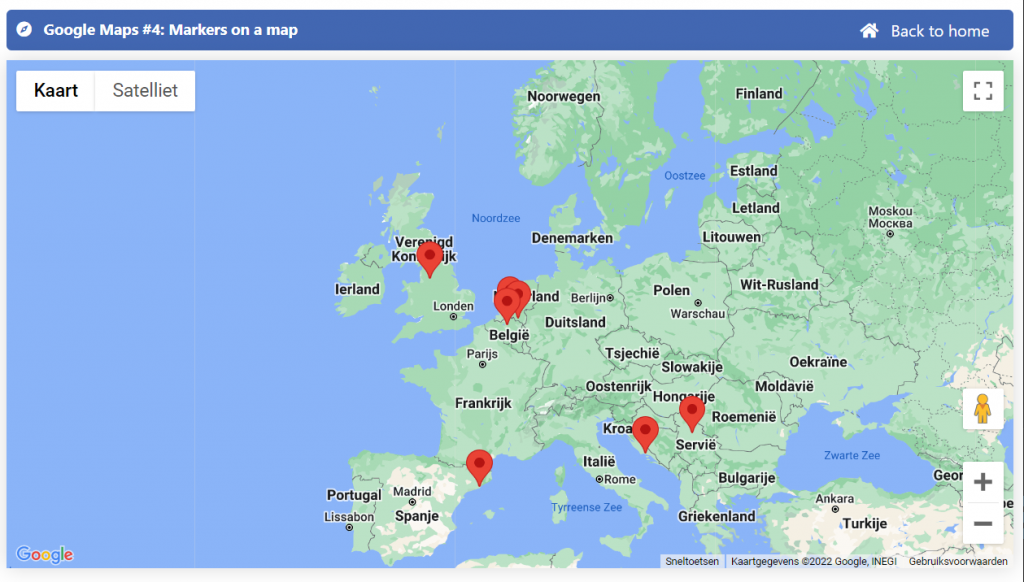
- We then loop through our data and create a marker for every row, using the latitude and longitude. We wrap our data in the parseFloat parameter to make sure that Google recognizes the coordinate as a number.
When we start our server we now see the markers on the map!
If you do not get the same result, please check if you correctly applied the steps from the previous post
Next time
In our next tutorial we will continue and explore different types of markers. We will explore how we can plot heatmaps and other type of overlays with the help of the Google Maps API! The full project code can be found on my Github.


duidelijk en zeer behulpzaam! hoop dat je de serie afmaakt. hartstikke bedankt