

In this blogpost we focus on creating a datamart in Power BI. We will highlight all the steps and explain the functionalities of the datamart in Power BI Online.
In our previous post we already explained what a datamart is and why you should use it.
Let’s get started!
In this blogpost we will create the datamart, show the ETL process, and connect to a cover the following steps:
- Creating our datamart
- Connecting to a data source
- Transforming our data
- Creating relationships and measures
- Querying data with T-SQL and no-code tool
- Visualizing our data in Power BI desktop
Prerequisites: To work with datamarts you will need access to Power BI Online (free) and access to a premium workspace (premium per user or capacity).
Creating our datamart
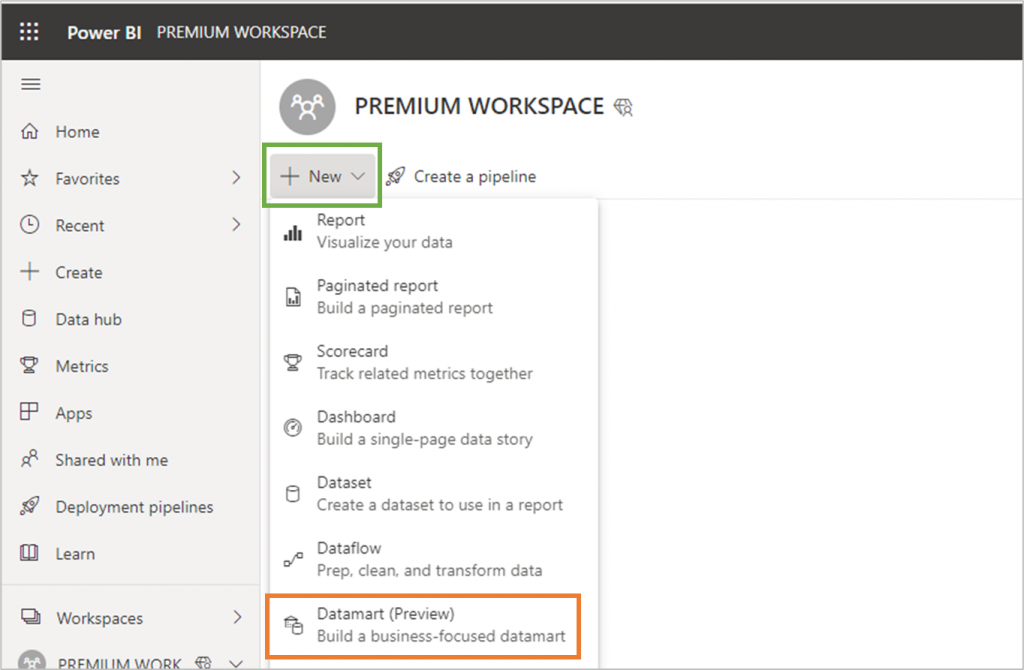
Go to Power BI online and enter your premium workspace. We can create a datamart by clicking on new and then datamart.
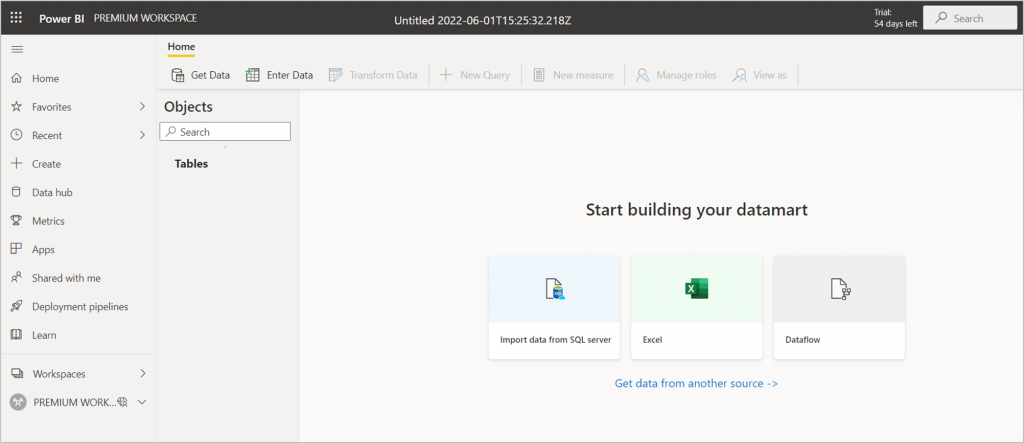
Power BI will now take some time to create your datamart! After a while you will land on this page:
Connecting to a data source
For this tutorial I created a small dataset with some statistics from the second division of dutch football (file below). Lets connect to this data source!
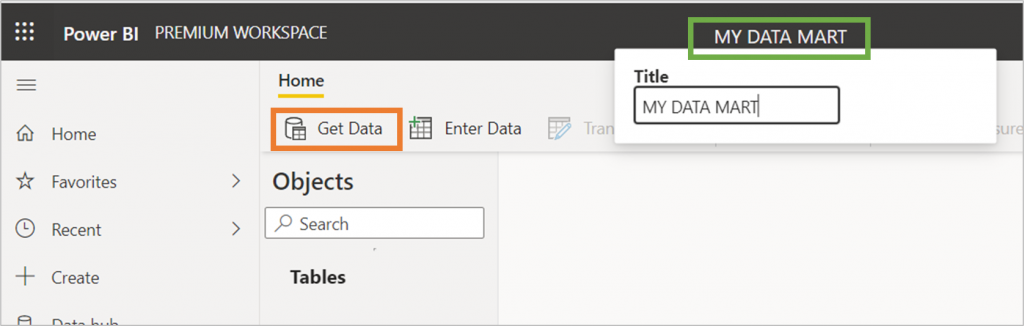
First, click on the name of the datamart at the top of the screen. There you can change the title to whatever you want. Next, click on get data.
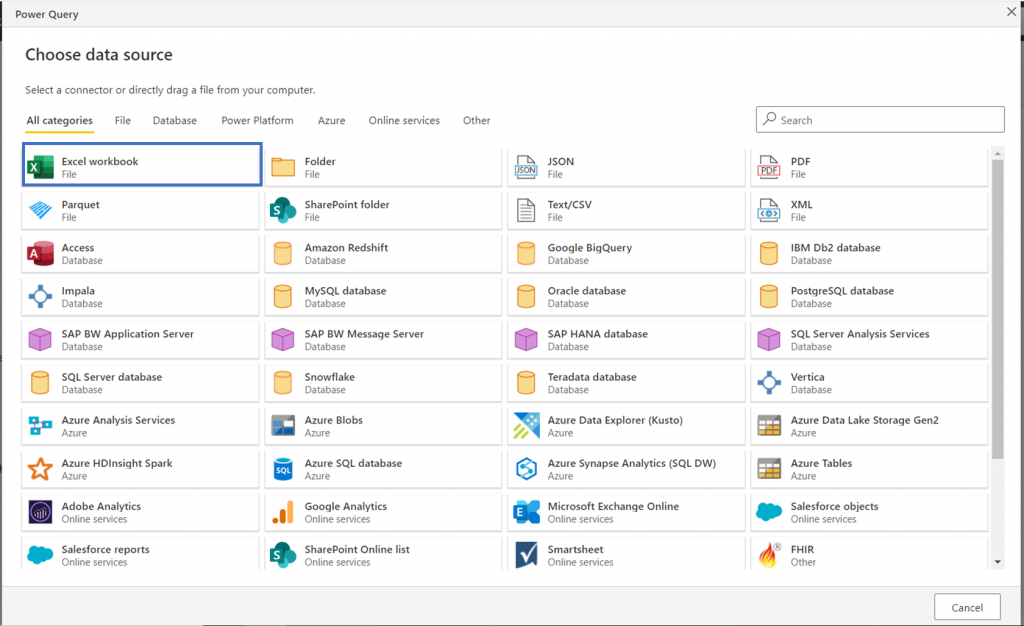
A Power Query window will open with a lot of connectors we can use. In this case we select the Excel workbook option.
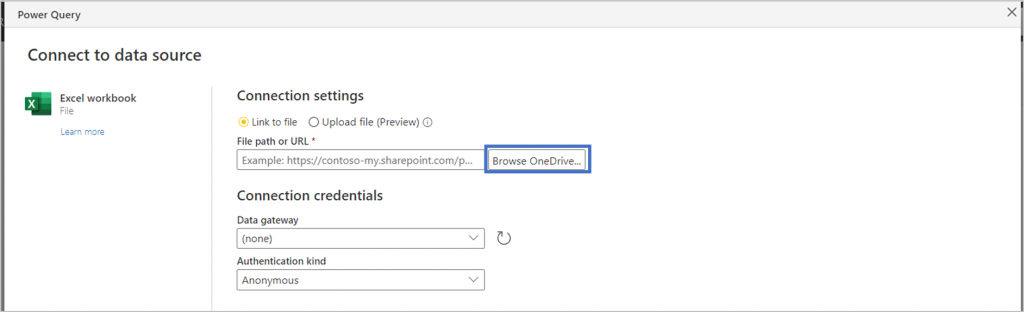
Since the file is in my onedrive I click on browse onedrive. This is great way to create agnostic filepaths that don’t point towards your private directory.
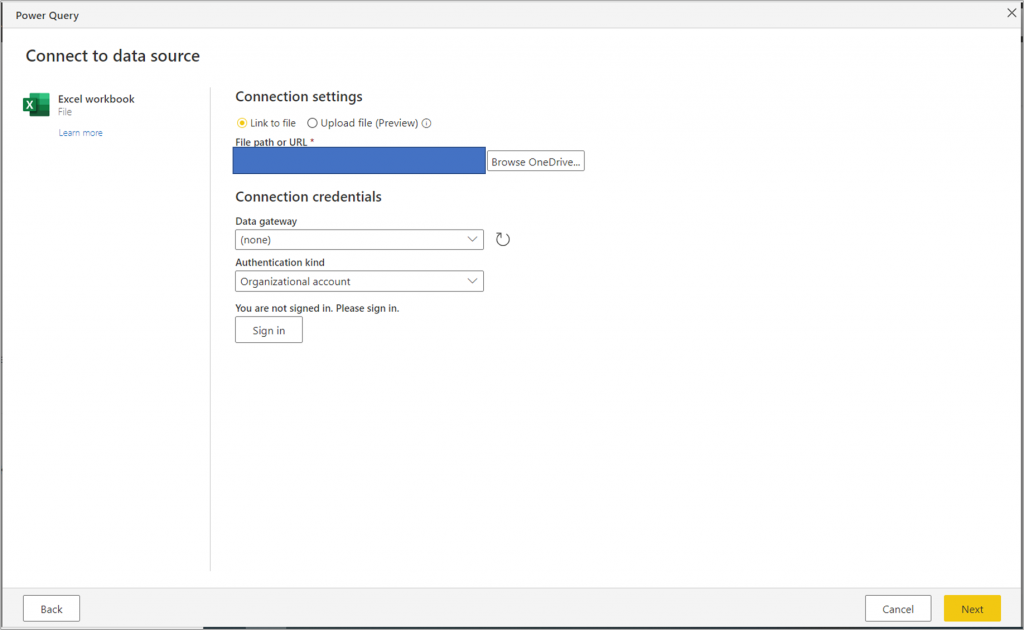
Select your file and click on next!
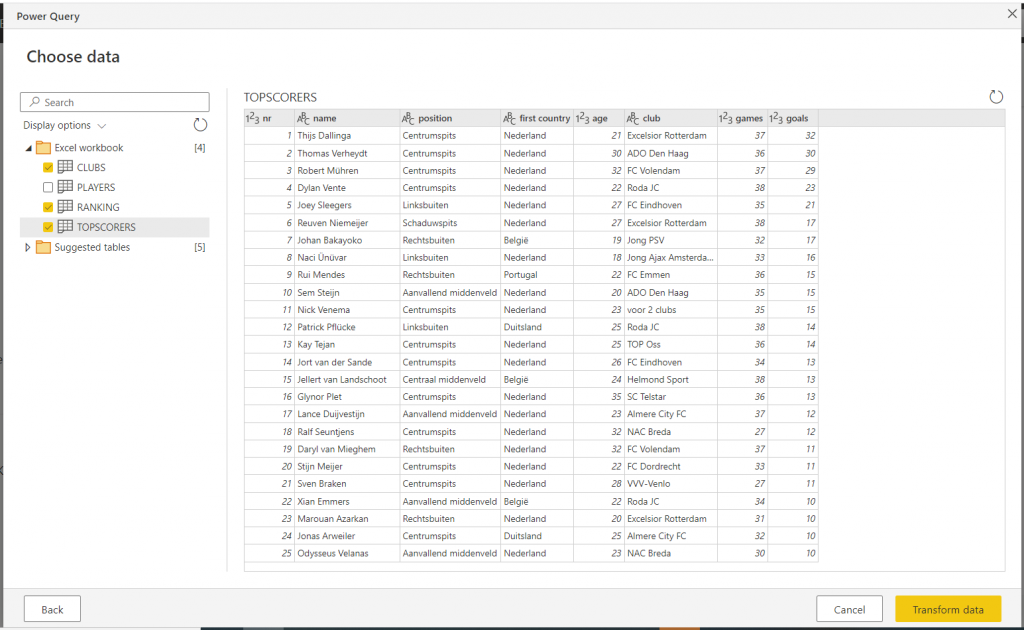
I select all the worksheets I need (Clubs, Ranking, Topscorers) and click on transform data.
Transforming the data
We now arrive at the transform data section of datamarts. You will notice it is very similar to Power Query from Power BI desktop.
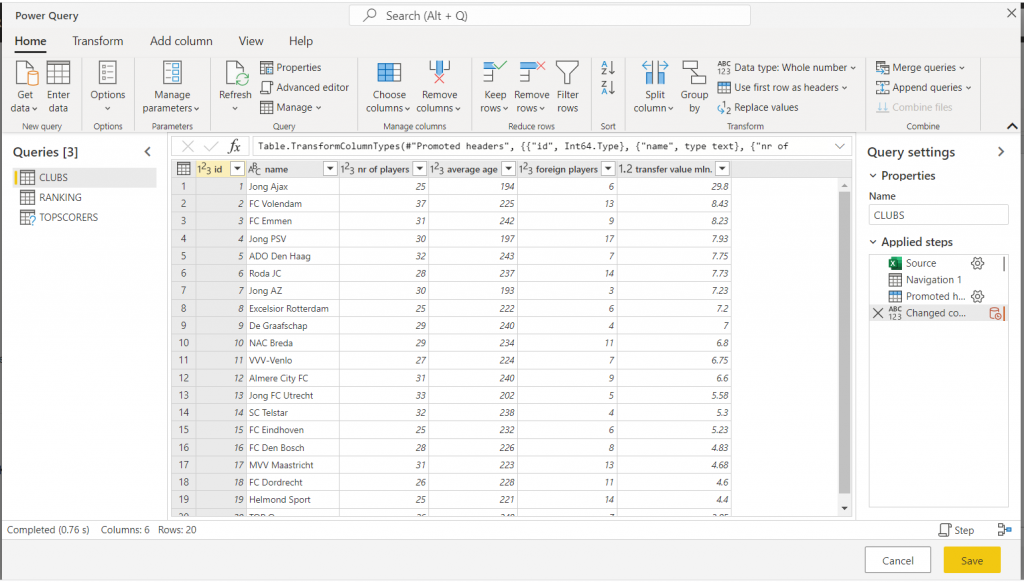
We can make some basic transformations. I notice that the average age is not displayed correctly since the comma is missing.
Therefore, I will change the column type from the column average age to text, replace the comma with a point, and then set the column type to decimal number.
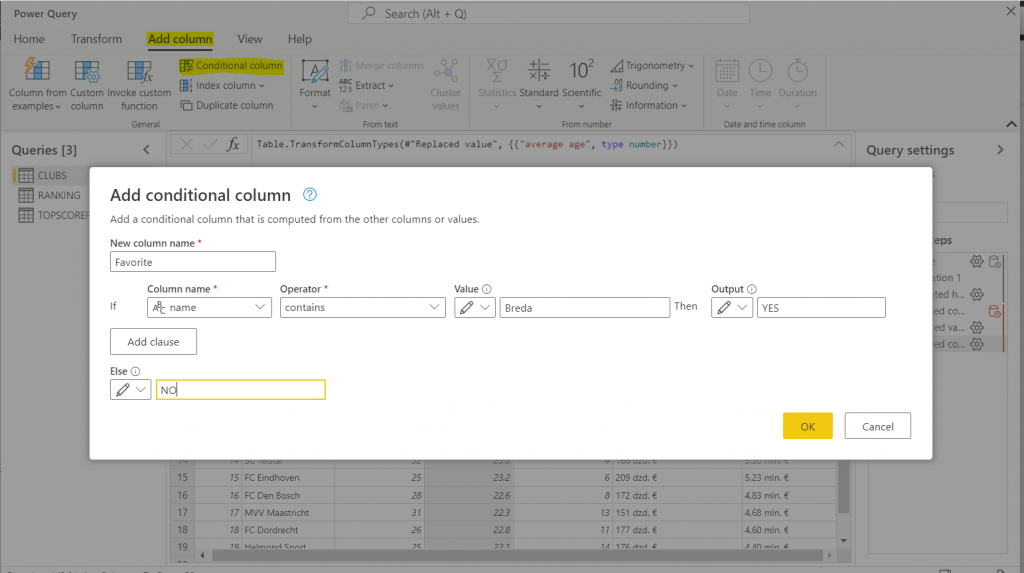
We can also add columns. For example a conditional column that specifies when Breda is in the club name I mark it as my favorite club.
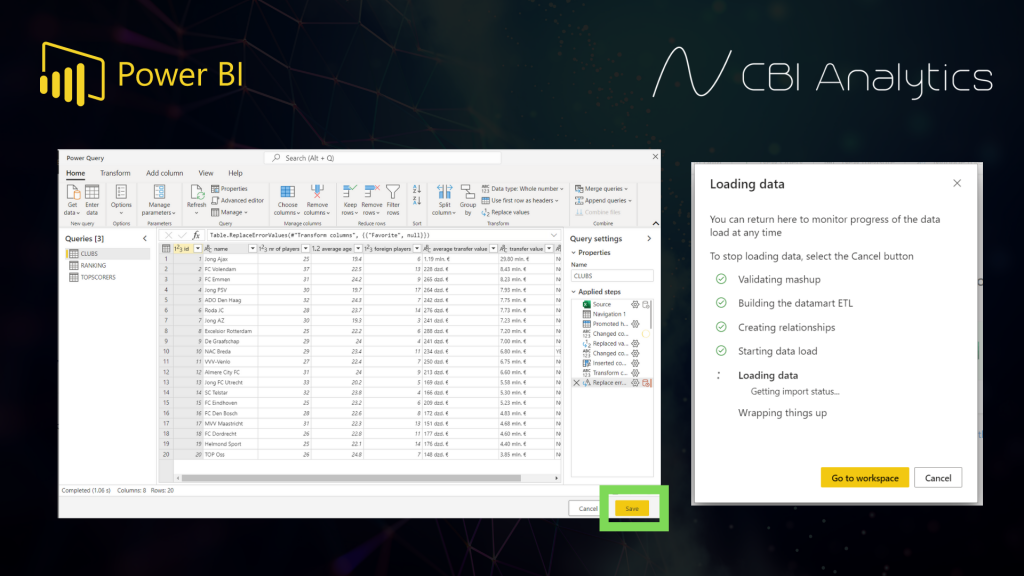
After your transformations are complete you can click on save, and Power BI will load the datamart.
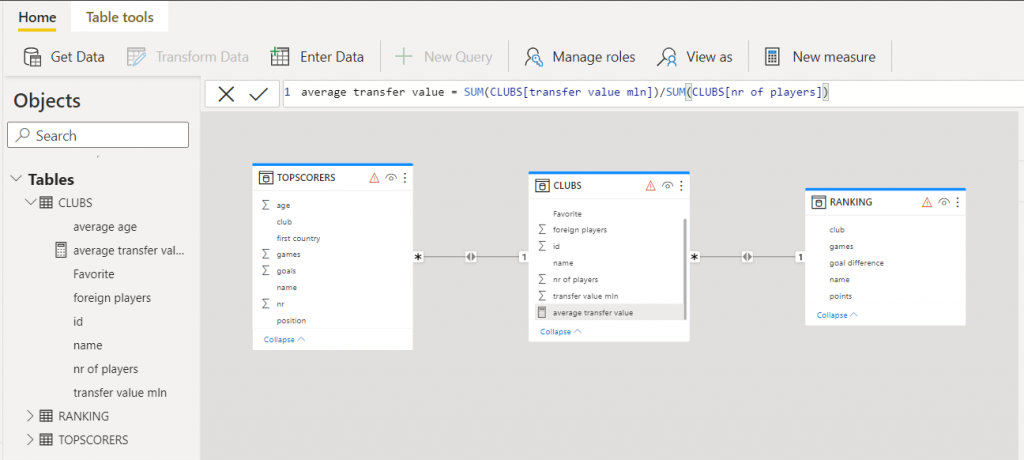
Creating relationships
Once the dataset is ready we can navigate to the relationship pane on the bottom right.
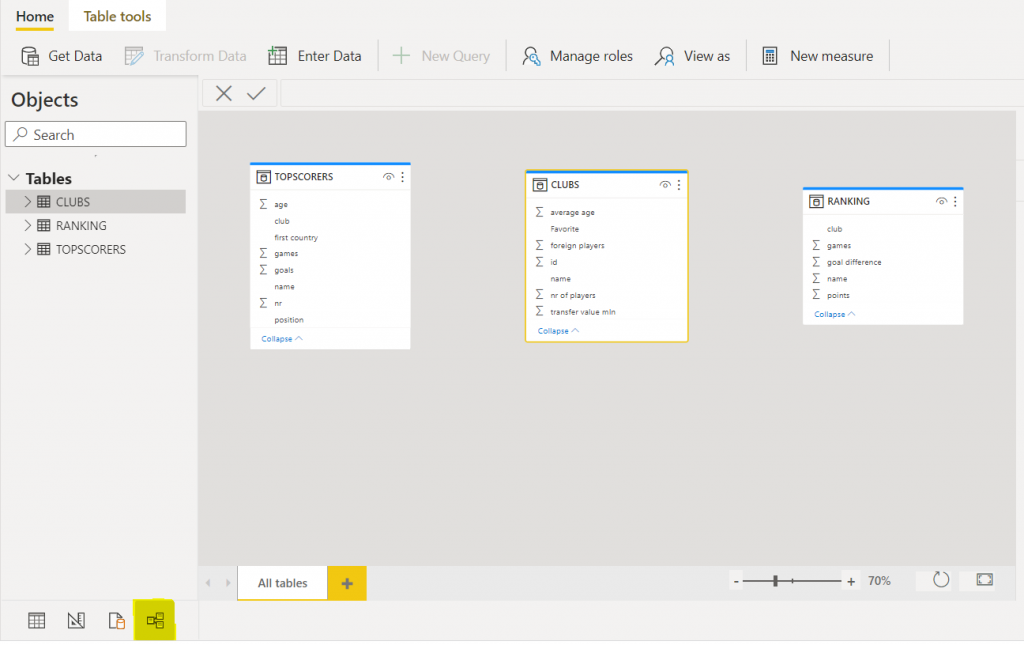
You can create relationships by dragging the columns between the tables.
In the same screen we can create measures by clicking on the measures button. For example, I calculate the average transfer value in millions per player.
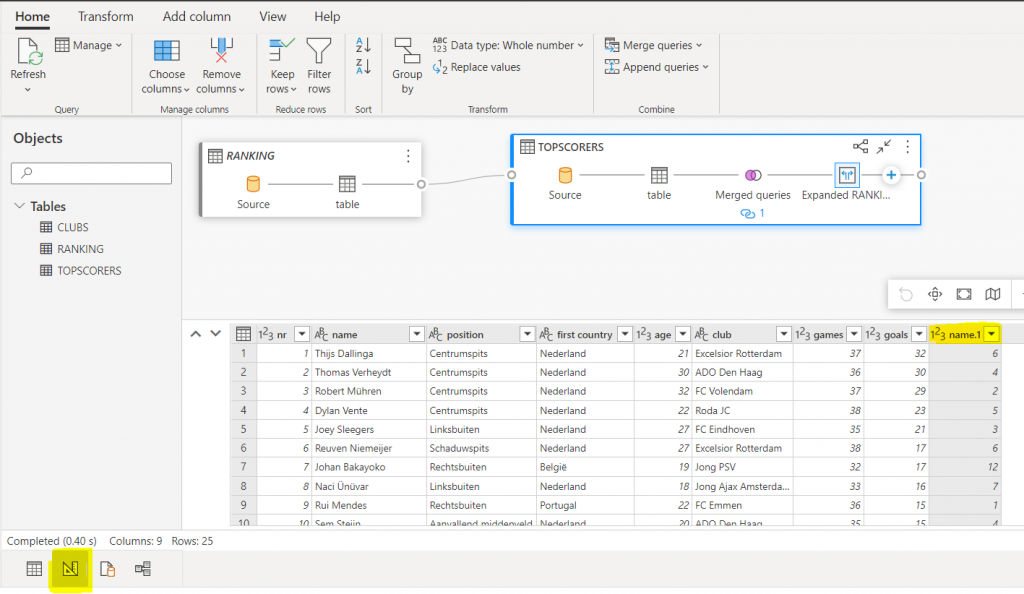
Querying data with T-SQL and no-code tool
There are two ways to query data in the datamart technology. First, you have a no-code user interface called design where you can build queries.
For example, in the image below I took the topscorers table and merged it with the ranking table to extract the place in the league of the topscorer.
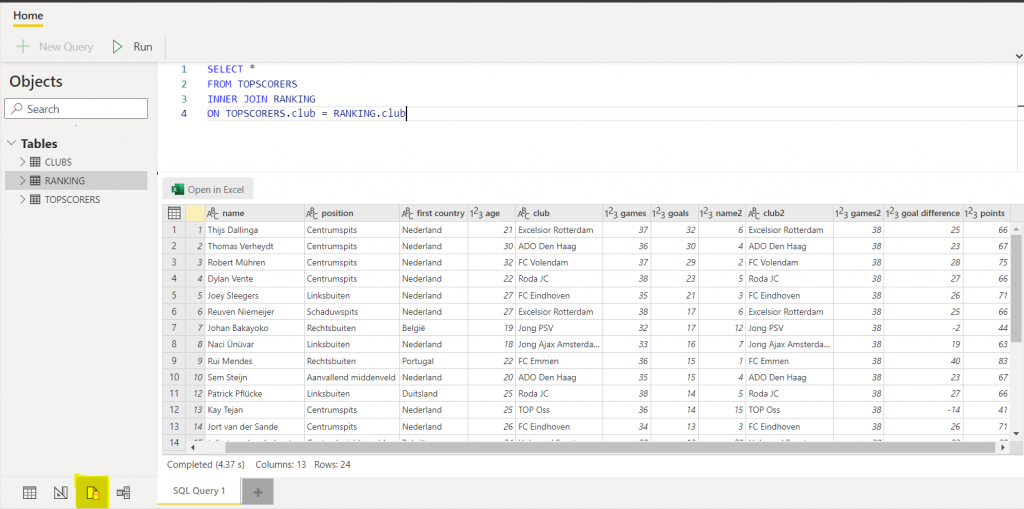
The second option is the SQL pane where you right T-SQL queries like the one below.
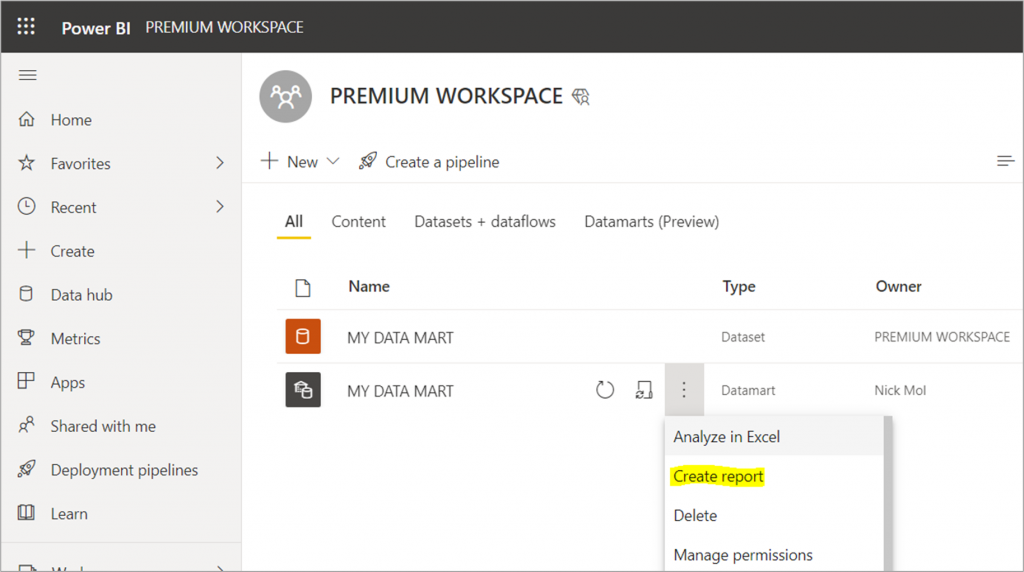
Visualizing our data in Power BI desktop
Now we can visualize the data, but how can we do this? There are 2 ways.
- You can go to your workspace in Power BI Online, click on the 3 dots, and select create report. This will create a Power BI report which you can dowload as pbix file.
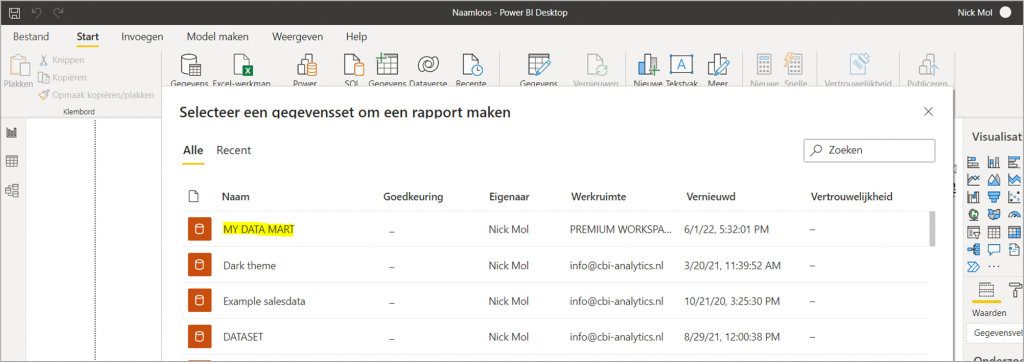
- You can also go to Power BI desktop, and click on Power BI Datasets. There you can pick the dataset which belongs to your datamart.
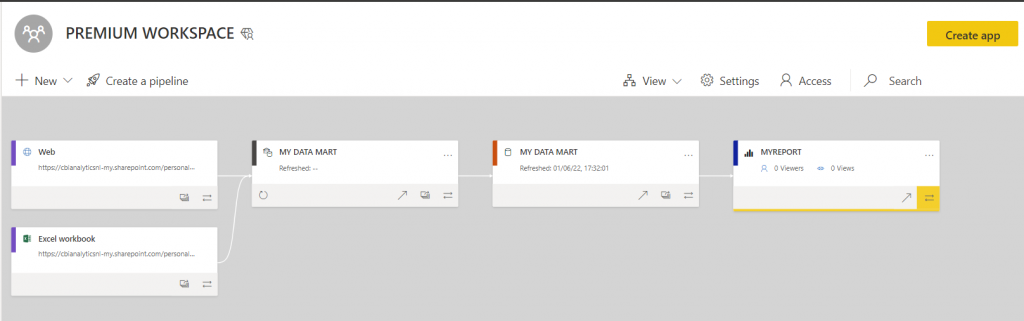
In both cases, Power BI will connect to the dataset which follows from the datamart. You can see this in the lineage view of the report you created through the workspace.
Datamarts: A cool addition to Power BI
Datamarts provide a new unique functionality, and we can’t wait to see which features which will be added in the future! Do you want to know more about this functionality or do you have questions? Contact us!